Some of the best gui system monitoring software options for Ubuntu are GNOME System Monitor, Mission Center, and Stacer. Because system administration and performance optimization require clear visual data, using a graphical dashboard helps track real-time CPU, memory, network, and storage usage without typing commands in the terminal.
This guide covers 12 graphical performance monitors verified for Ubuntu 26.04 LTS and 24.04 LTS. They are grouped into four categories: desktop native monitors, modern custom utilities, hardware sensor tools, and web-based dashboards. Each desktop app includes the exact terminal installation command so you can set up your system charts immediately.
sudo apt install btop or sudo apt install htop.Top Pick per Use Case
- Best for Workstation CPU/RAM: Mission Center – modern GTK4 interface, Windows-like dashboard layout, and real-time thread/GPU tracking
- Best for System Cleaning & Tweaking: Stacer – all-in-one monitor, cache cleaner, service toggle, and startup controller
- Best for Servers & Web Admins: Cockpit – browser-based secure interface for remote management and container stats
Desktop Native Monitors
These monitors are built specifically for their respective desktop environments. They offer clean, native system integration, stable performance, and the lowest compatibility overhead for standard Ubuntu installations.
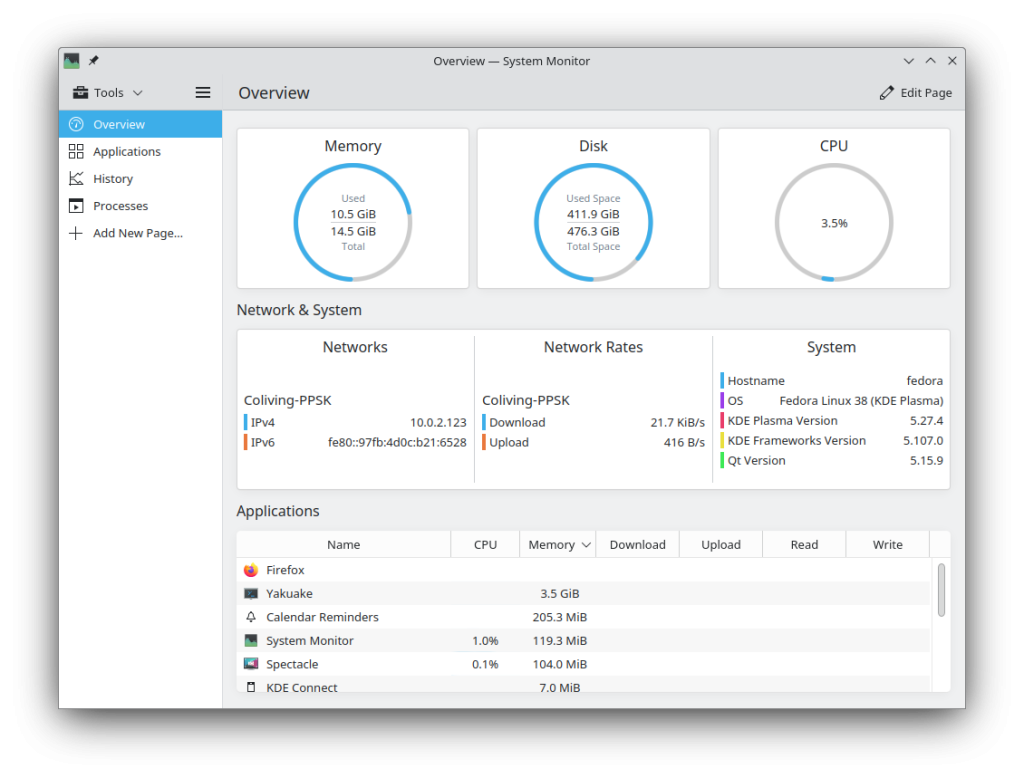
Best For: Native Ubuntu default, reliable CPU/RAM tracking and process management.
Why Choose It? GNOME System Monitor is pre-installed on Ubuntu by default. It provides a simple tabbed view for resources and processes. You can easily view resource graphs (CPU, RAM, swap, network) and search for processes to end or pause. It is highly stable and integrated with the Ubuntu desktop environment.
- Pros: Pre-installed on main Ubuntu desktop, low memory usage, allows terminating frozen processes easily.
- Cons: Traditional visual graphs are basic compared to modern Rust monitors.
Install Command:
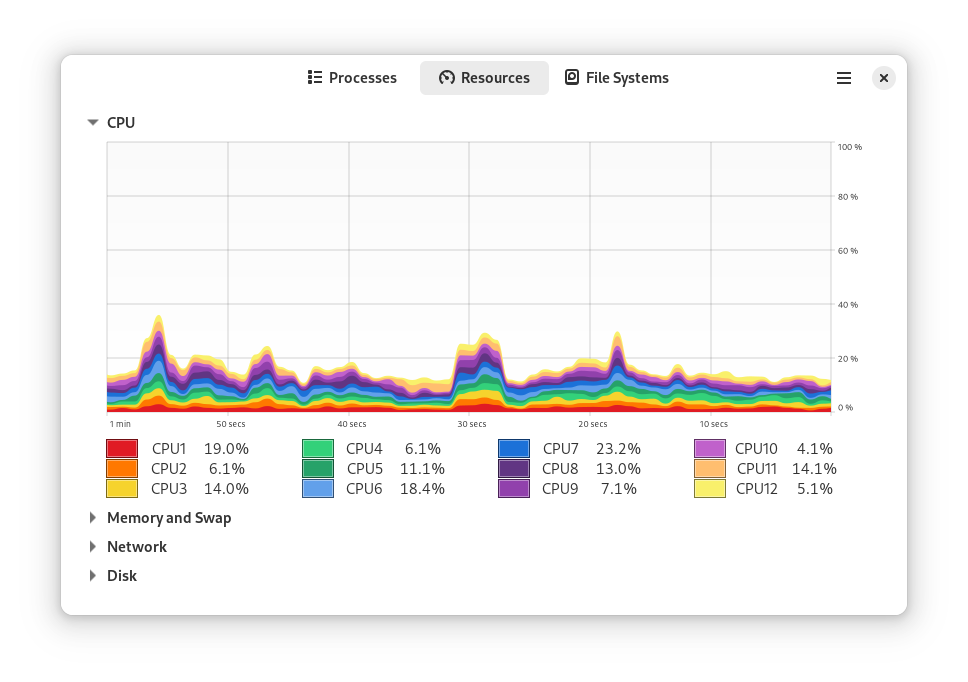
Best For: KDE Plasma users, highly custom dashboard creation.
Why Choose It? Built for KDE desktop environments (and pre-installed on Kubuntu), Plasma System Monitor is a modular resource visualizer. Users can design custom pages, drag and drop sensor meters, and construct personalized layouts with tables, line graphs, or circular sensors. It uses Qt6 libraries natively, ensuring deep desktop integration.
- Pros: Support for building custom sensor grids, modular widgets, deep integration with KDE libraries.
- Cons: Pulls heavy Qt dependencies if run outside of a KDE desktop environment.
Install Command:
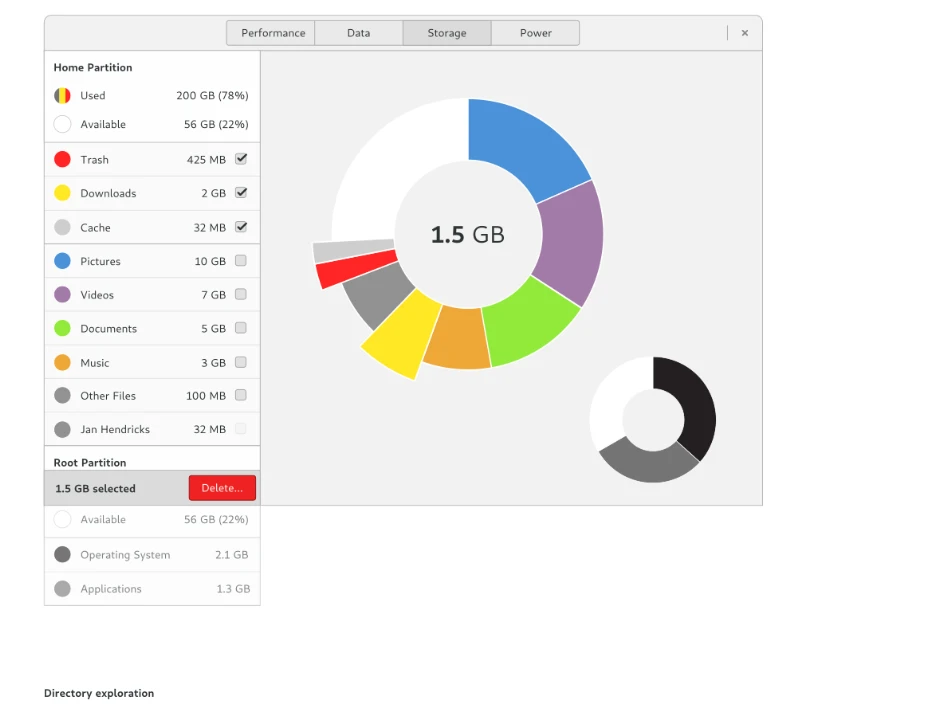
Best For: Simplified app-level insights, clear storage visualization.
Why Choose It? GNOME Usage is a simplified alternative to GNOME System Monitor. Instead of displaying complex grids and raw diagnostic numbers, it provides basic progress bars for processor and RAM tracking. It also features a useful disk analysis view, letting you visualize folders and files eating storage space so you can clean them up easily.
- Pros: Extremely simple visual bars, useful storage cleanup map, friendly for beginners.
- Cons: Lacks advanced network diagnostics, sensor values, or granular process control.
Install Command:
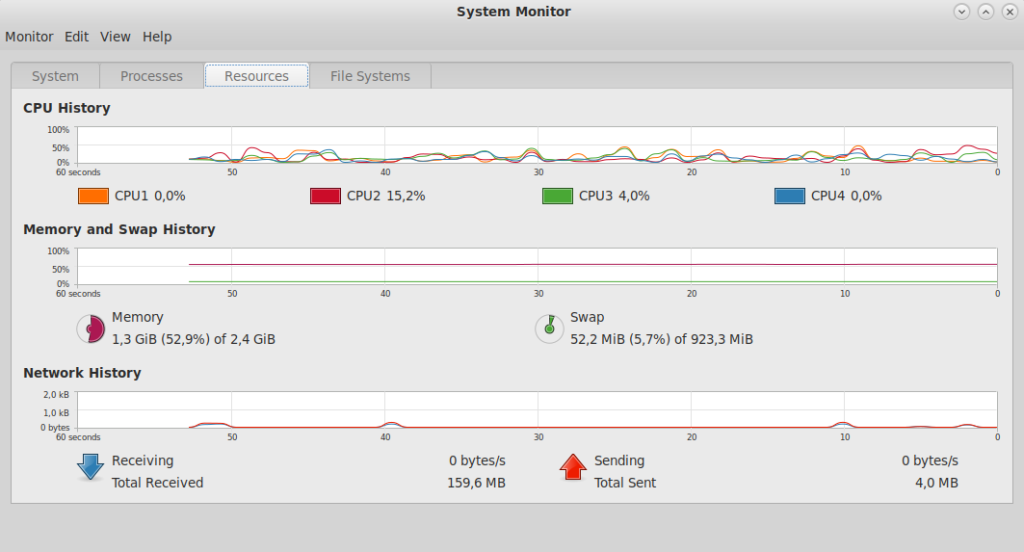
Best For: Classic lightweight GTK environments.
Why Choose It? Standard on the Ubuntu MATE flavor, this application uses a traditional interface style. It displays simple grid lines and process tabs, avoiding graphic smoothing or complex visualization wrappers. This keeps its memory footprint low, making it ideal for older processors or minimal environments like XFCE and LXQt.
- Pros: Runs smoothly on extremely old processors, uses minimal memory, features a stable, retro layout.
- Cons: Lacks modern GPU charts or high-resolution real-time smoothing.
Install Command:
Modern Custom Monitors
Built using modern languages (like Rust) and modern interface design systems (like GTK4 and Libadwaita), these monitors provide visual excellence, high-resolution smoothing, and GPU tracking for workstations.
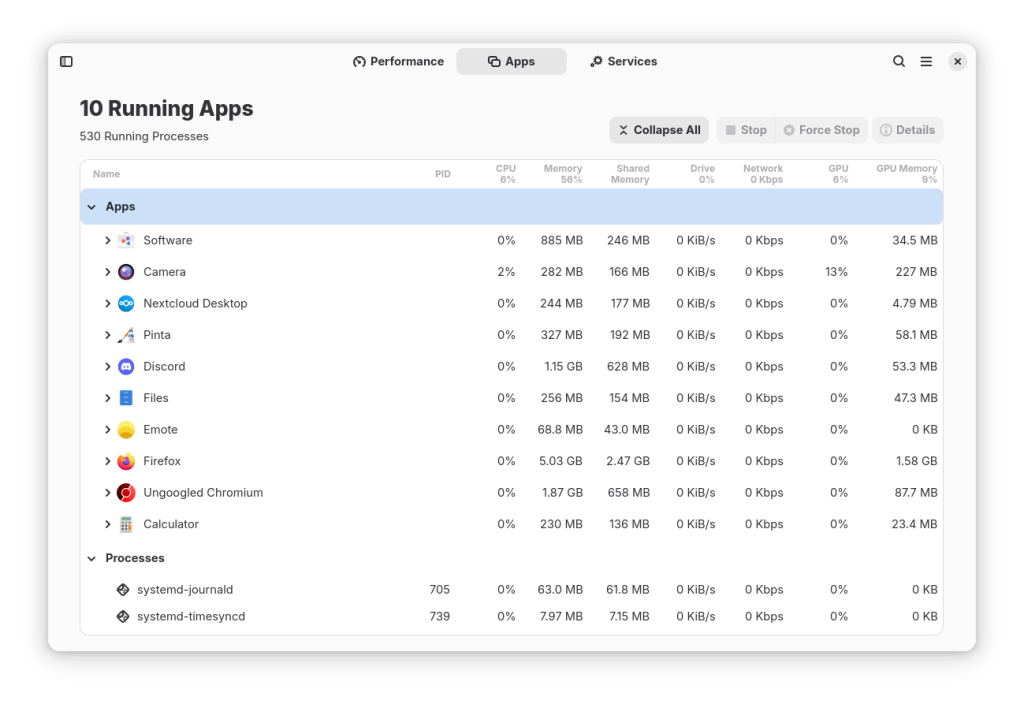
Best For: Modern GTK4 interface, Windows Task Manager layout, GPU monitoring.
Why Choose It? Mission Center is one of the most popular Linux monitors. Written in Rust with a clean GTK4 UI, its layout matches the Windows 11 Task Manager. It displays detailed visual columns for CPU logical threads, memory channels, disk input-output rates, network adapter statistics, and dedicated hardware rendering charts for AMD, Intel, and NVIDIA GPUs.
- Pros: Stunning GTK4/Libadwaita charts, tracks dedicated NVIDIA/AMD graphics cards, lets you view and start system background services.
- Cons: Requires Flatpak or compiling from source to run on Ubuntu.
Install Command:
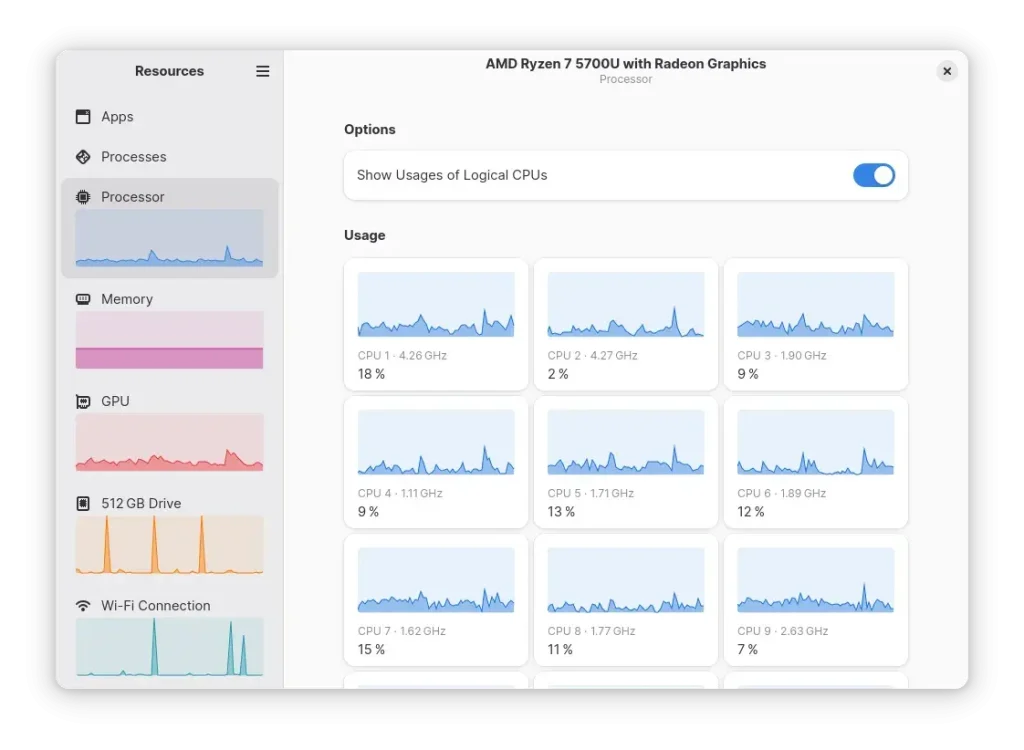
Best For: Minimalist design, fast Rust-based CPU/RAM graphs.
Why Choose It? Resources is a sleek, modern system monitor built with Rust. It provides a visual dashboard focusing on minimal graphics and fast responsiveness. It tracks CPU, RAM, disk, network usage, and features advanced GPU and NPU (Neural Processing Unit – specialized AI chips) monitoring. Due to its code quality, it has been merged into the GNOME Incubator, making it a future core application candidate.
- Pros: Blazing-fast performance, elegant graphs, tracks GPU and NPU metrics.
- Cons: Distributed mainly as a Flatpak, meaning sandbox permissions must be handled.
Install Command:
Best For: Visual system dashboard, cache cleanup, startup app control.
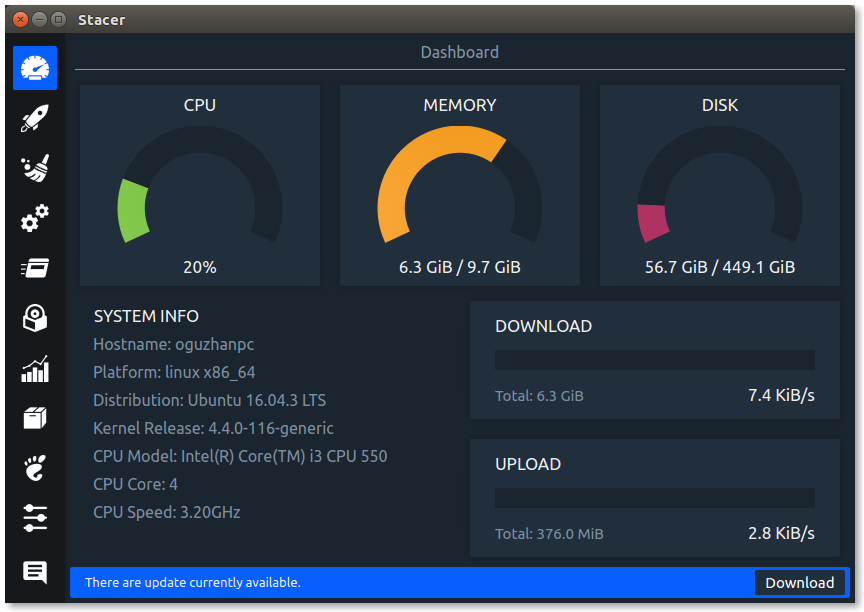
Why Choose It? Stacer goes beyond monitoring by integrating system optimization tools. Its visual dashboard displays CPU, memory, disk, and real-time network charts. In addition, it features built-in tools for package uninstallation, clearing system cache databases, enabling or disabling startup applications, and starting or stopping system background services.
- Pros: Built-in disk cleaner, startup app manager, package uninstaller, and service monitor in a beautiful dashboard.
- Cons: Heavier memory footprint than pure system monitors due to its Qt GUI framework.
Install Command:
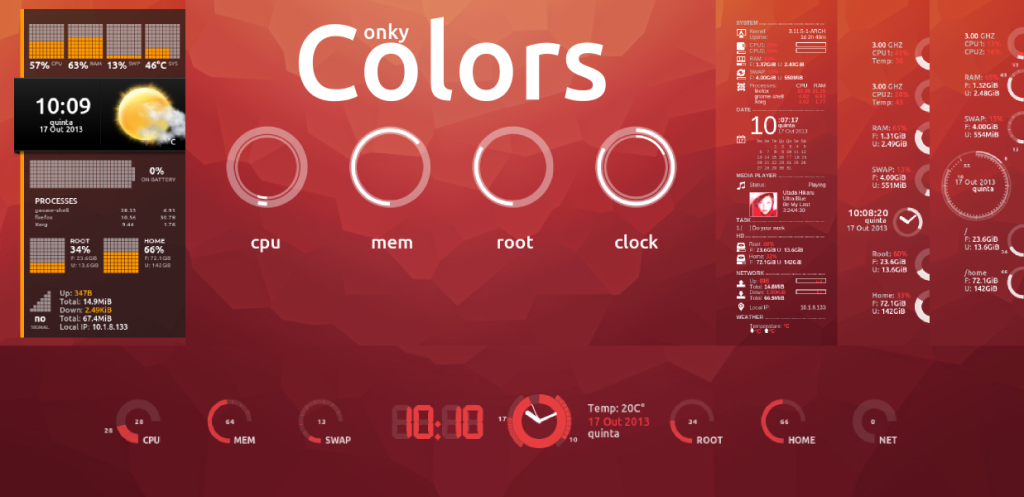
Best For: Custom desktop widget overlays, HUD monitoring.
Why Choose It? Conky is an advanced desktop widget toolkit. Instead of running inside an application window, it renders performance statistics directly onto your wallpaper like a HUD overlay. You can write custom configuration files (using Lua scripting) to design dials, graphs, clocks, and calendar templates matching your desktop theme.
- Pros: Displays stats directly on your desktop wallpaper, uses virtually no RAM, supports complex Lua scripts for theme designs.
- Cons: Extremely steep learning curve; requires editing text configuration files to build a GUI widget.
Install Command:
Hardware & Specialized Utilities
These applications focus on hardware layer integration. They query deep driver paths to control fans, monitor component temperatures, and profile physical hardware specifications with built-in benchmarks.
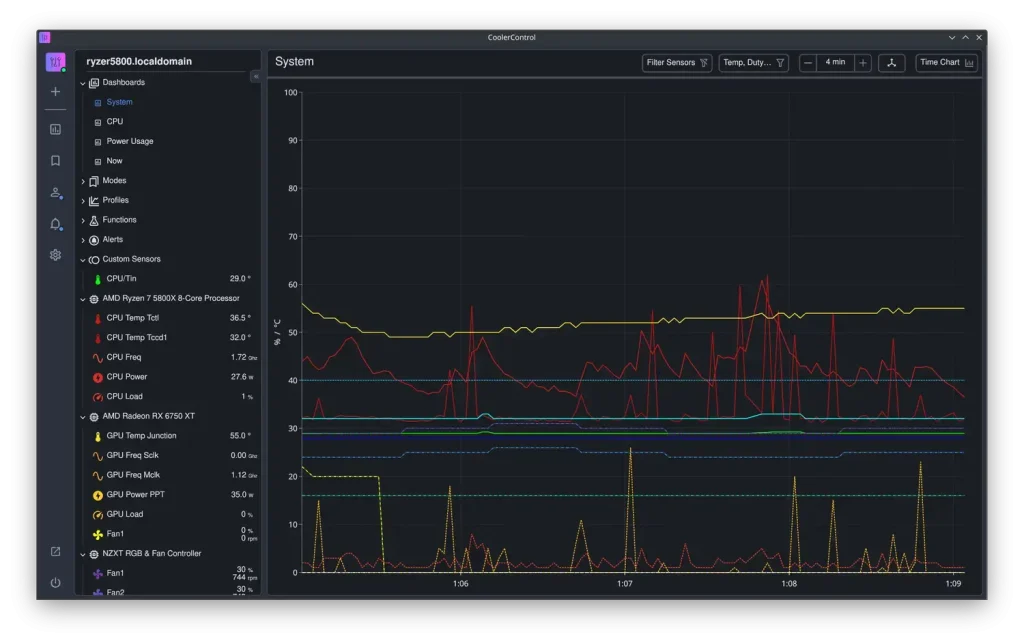
Best For: Specialized fan controller background service, hardware temperature tracking.
Why Choose It? CoolerControl operates as a background service (`coolercontrold`) paired with a Web UI or desktop app window. It lets you monitor liquid cooling pump speeds, fan RPMs, and temperatures. You can configure custom fan curves, mix multiple sensor values together, and manage cooling profiles depending on system hardware activity.
- Pros: Controls liquid cooling AIOs, Nvidia/AMD GPU fans, supports complex mixing sensor curves.
- Cons: Requires adding a third-party Cloudsmith repository and running a background system service.
Install Command:
sudo apt update && sudo apt install coolercontrol
sudo systemctl enable –now coolercontrold
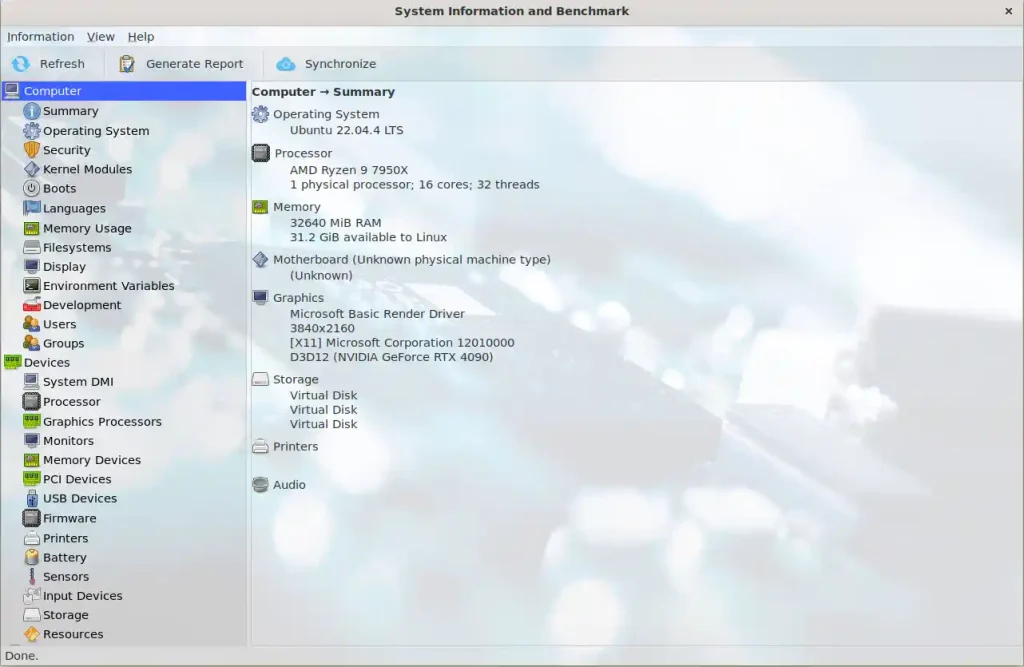
Best For: Complete hardware spec profiling and system benchmarks.
Why Choose It? Hardinfo serves as a graphic device manager and system benchmark dashboard. It generates layout lists of processor features, kernel drivers, disk drives, USB hubs, PCI bridges, and hardware sensors. Additionally, it offers quick built-in mathematical benchmarks (like CPU Blowfish and FPU Raytracing) to verify resource efficiency against standard benchmark databases.
- Pros: Provides detailed spec sheets for CPU, sensors, USB, PCI devices, and features built-in benchmarks (like CPU Blowfish).
- Cons: The user interface looks dated (GTK2/3 classic styling), and graphs are static rather than animated.
Install Command:
Web-Based & Remote Dashboards
These tools deploy visual web services. They run secure background monitoring engines, rendering real-time performance graphs and server metrics inside any standard browser dashboard.
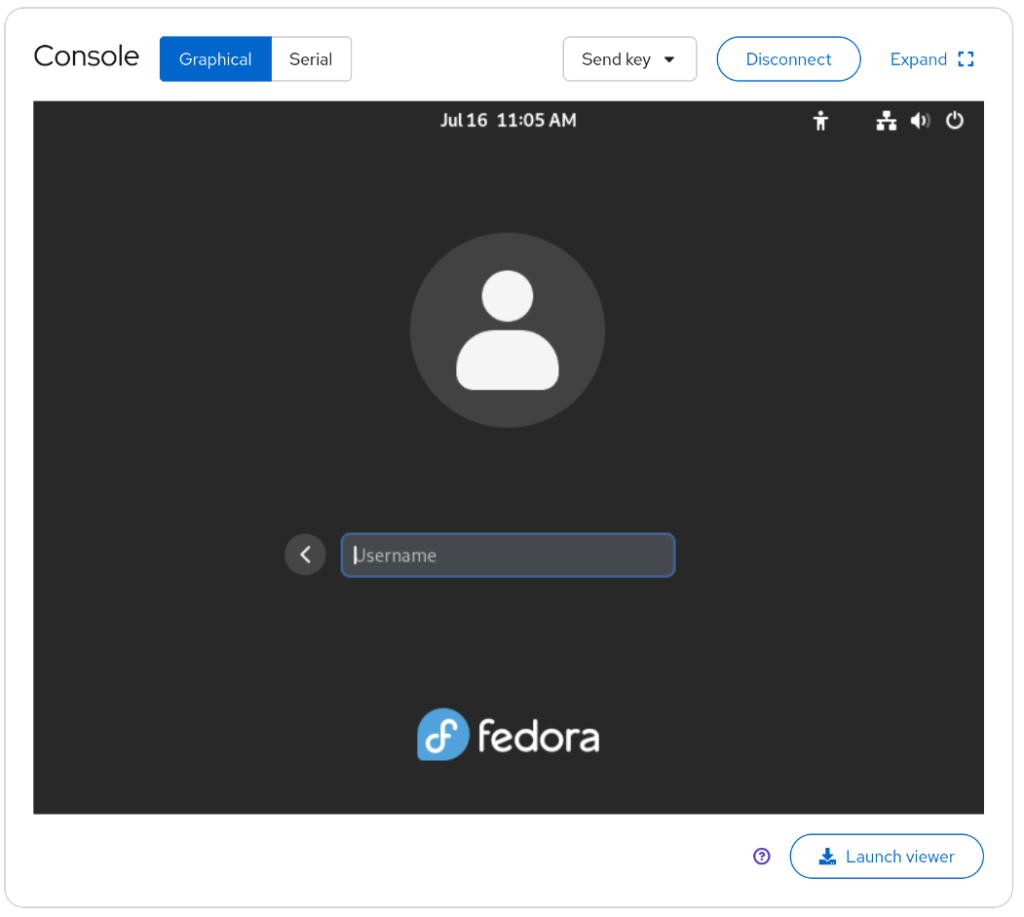
Best For: Browser-based server admin, remote system management.
Why Choose It? Cockpit provides a web-based administration dashboard for local or remote Ubuntu servers. Accessing the service over port 9090 displays processor load, storage health, network logs, and system service profiles. It also features a built-in terminal wrapper and a container dashboard to manage Docker or Podman instances securely.
- Pros: Manage remote servers from any web browser, manage storage pools, review system logs, toggle system updates.
- Cons: Starts a web service listening on port 9090, creating a potential network access point if not secured.
Install Command:
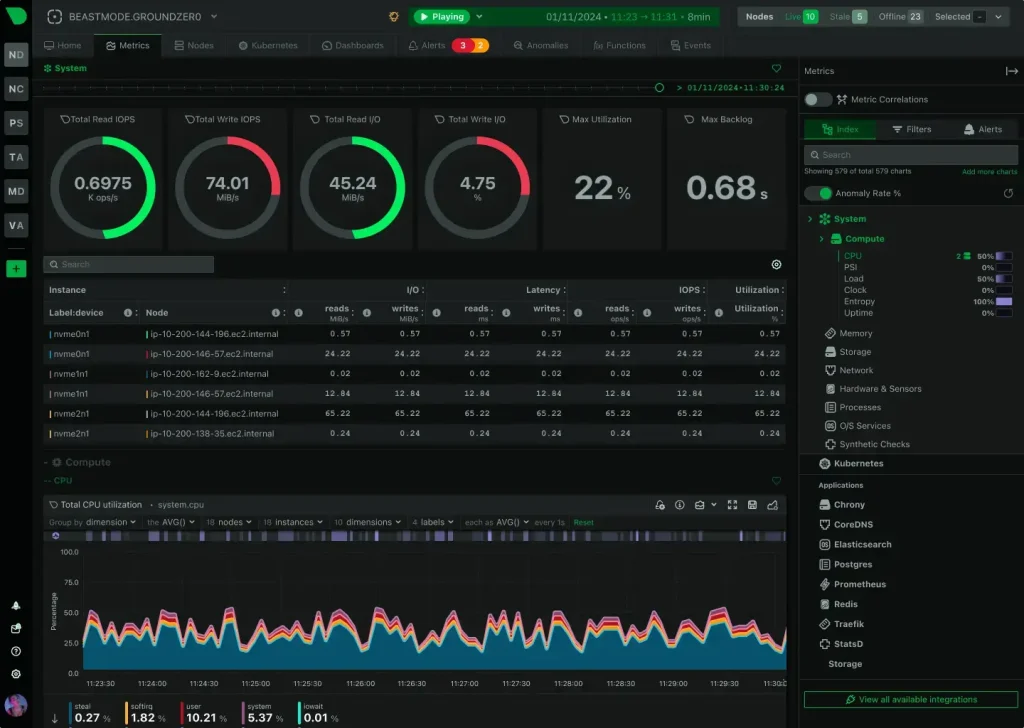
Best For: Real-time microsecond-level performance diagnostic dashboards.
Why Choose It? Netdata provides microsecond-level performance diagnostics. By starting a web monitoring engine, it gathers thousands of real-time metrics automatically. Connecting to port 19999 loads visual charts showing memory swapping, socket connections, network throughput, disk IO bottlenecks, and hardware queue statuses instantly.
- Pros: Highly interactive graphs, tracks thousands of metrics automatically, zero-configuration setup.
- Cons: Highly detailed tracking that can generate large numbers of alerts if not custom configured.
Install Command:
System Monitor Comparison Table
| Application | Main Interface | CPU/RAM Footprint | Unique Feature | Package Source |
|---|---|---|---|---|
| GNOME System Monitor | GTK Desktop App | Low (~30 MB RAM) | Pre-installed process control | Ubuntu APT Repositories |
| Plasma System Monitor | Qt Desktop App | Moderate (~45 MB RAM) | Custom grid dashboards | Ubuntu APT Repositories |
| GNOME Usage | GTK Desktop App | Very Low (~20 MB RAM) | Visual storage analyzer | Ubuntu APT Repositories |
| MATE System Monitor | GTK Classic UI | Very Low (~18 MB RAM) | Vintage layout, high speed | Ubuntu APT Repositories |
| Mission Center | GTK4 Desktop App | Moderate (~50 MB RAM) | Dedicated GPU tracking | Flathub (Flatpak) |
| Resources | GTK4 Desktop App | Low (~25 MB RAM) | NPU and GPU tracking | Flathub (Flatpak) |
| Stacer | Qt Desktop App | High (~90 MB RAM) | Disk cleanup and optimizer | Ubuntu APT Repositories |
| Conky | Wallpaper HUD Widget | Very Low (~10 MB RAM) | Lua script desktop styling | Ubuntu APT Repositories |
| CoolerControl | Web/GTK Hybrid | Moderate (~40 MB RAM) | AIO liquid cooling pumps | Cloudsmith Debian Repo |
| Hardinfo | GTK Desktop App | Low (~22 MB RAM) | Hardware spec benchmark | Ubuntu APT Repositories |
| Cockpit | Web Browser UI | Low (~25 MB background service) | Remote server management | Ubuntu APT Repositories |
| Netdata | Web Browser UI | High (~120 MB RAM) | Microsecond diagnostic data | Snap Store (Canonical) |
Which GUI System Monitor Is Right for You?
Install Mission Center. It provides clean separate tabs for CPU, memory, storage disks, network, and GPU stats, making it extremely familiar for Windows migrators.
Use Stacer. Beside tracking processor graphs, it lets you clear system databases, purge application cache folders, and toggle startup programs securely.
Install CoolerControl. It queries hardware sensors to let you manage Nvidia/AMD GPU fan curves, CPU cooling speeds, and liquid AIO pumps visually.
Deploy Cockpit. It launches a secure background web service on port 9090, letting you review storage arrays, verify system update configurations, and access server terminals.
Configure Conky. It draws performance indicators directly on your desktop wallpaper. It uses virtually zero RAM but requires script customization.
Open GNOME System Monitor. It is pre-installed on main Ubuntu desktop editions and lets you force-kill hung applications in a couple of clicks.
Troubleshooting & Helper Box
- Flatpak Sandbox Restrictions (Resources & Mission Center): Flatpaks run in isolated zones. If graphical monitors cannot query host disks or network, run:
flatpak override –filesystem=host net.nokyan.Resources
flatpak override –filesystem=host io.missioncenter.MissionCenter - Enable Cockpit Socket Service: If the Cockpit login screen does not load at `https://localhost:9090`, enable the socket service:
sudo systemctl enable –now cockpit.socket
- Netdata Local Host Access: By default, Netdata is accessible on the local network via port 19999. If it fails to connect, verify your local firewall configuration and allow incoming TCP traffic:
sudo ufw allow 19999/tcp
Frequently Asked Questions
What is the best GUI system monitor for Ubuntu?
GNOME System Monitor and Mission Center are the two best choices. GNOME System Monitor is pre-installed, reliable, and handles basic process management. Mission Center features a modern GTK4 layout similar to Windows Task Manager, offering detailed per-thread metrics and dedicated GPU charts.
How do I monitor GPU usage in Ubuntu?
You can monitor GPU usage graphically using Mission Center or Resources. These tools query system drivers via NVTOP or proprietary drivers to show real-time memory usage, temperature, and processing load for AMD, Intel, and NVIDIA graphics hardware.
How do I install Mission Center on Ubuntu?
The recommended way to install Mission Center on Ubuntu is via Flatpak. First, install Flatpak support by running sudo apt install flatpak in your terminal. Next, add the Flathub repository and install the application using the command flatpak install flathub io.missioncenter.MissionCenter.
What is the difference between Cockpit and Netdata?
Cockpit is a comprehensive server administration interface that lets you manage storage pools, network configurations, system background services, and user accounts. Netdata is a dedicated real-time performance dashboard designed for high-resolution performance monitoring, updating metrics at the microsecond level.
How do I grant system permissions to Flatpak system monitors?
System monitors packaged as Flatpaks (like Resources or Mission Center) may need permission overrides to read host metrics. You can grant access to the host filesystem by running the command flatpak override –filesystem=host net.nokyan.Resources or flatpak override –filesystem=host io.missioncenter.MissionCenter.
More Ubuntu utility & software guides: Ubuntu Keyboard Shortcuts · Best Remote Desktop Software · Share Files Between Ubuntu & Windows · Play DVDs in Ubuntu · Microsoft Office Alternatives