In 2025, your Ubuntu desktop isn’t just a workspace, it’s your mission control for a faster, safer, and more efficient system.
For Ubuntu 24.04 users, the choices are rich, each monitoring app bringing its own clarity and control.
Whether you want simple real-time stats, deep-dive diagnostics, or sleek dashboards, we’ve got you covered.
Let’s explore the best monitoring GUI apps for Ubuntu 24.04 in 2025 and lock in your perfect toolkit.
Pro Tip: Most apps here are a snap to install via the Ubuntu Software Center or a quick terminal command like sudo apt install gnome-system-monitor.
P.S. I’m still hooked on Mission Center for its clean, modern feel and fast process view.
What about you? Let me know your favorite in the comments below.
Top Monitoring GUI Apps for Ubuntu in 2025
1. GNOME System Monitor: Best for Simple, Native Monitoring
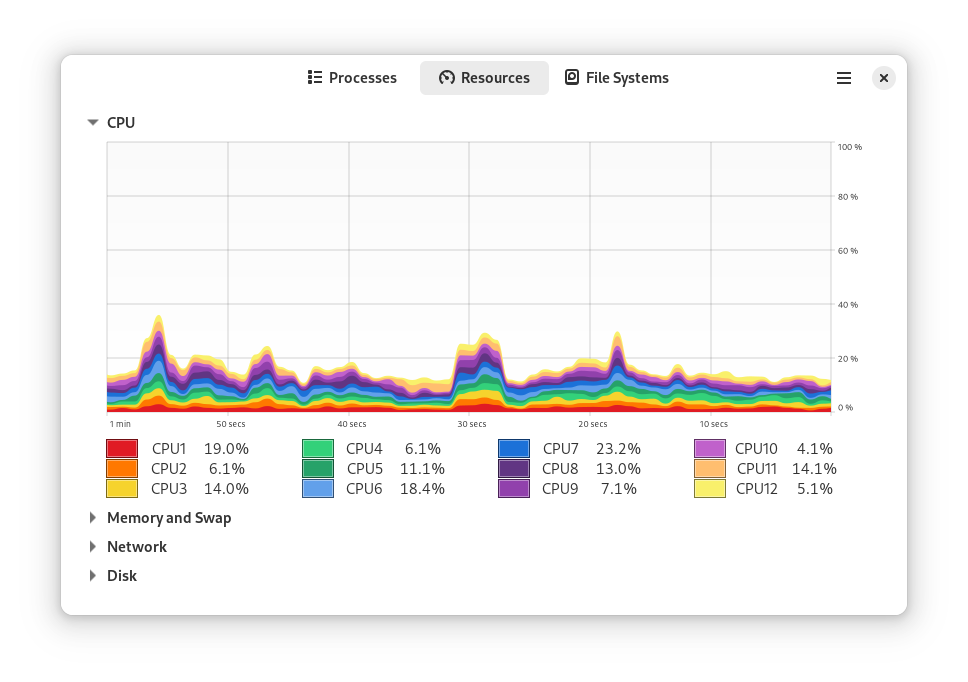
Why Choose It? GNOME System Monitor gives you clean process management, resource graphs, and file system insights in a familiar interface. It’s lightweight, fast, and perfectly integrated with Ubuntu’s GNOME desktop.
- Real-time CPU, memory, and network graphs
- Easy process management with search and filters
- Native GNOME integration and theming
Quick Tip: 💡 Right-click a process to change priority for quick responsiveness wins.
Support Links: GNOME Help | GNOME Reddit
🌐 Download from the Official Website
2. Netdata: Best for Real‑Time Web Dashboards
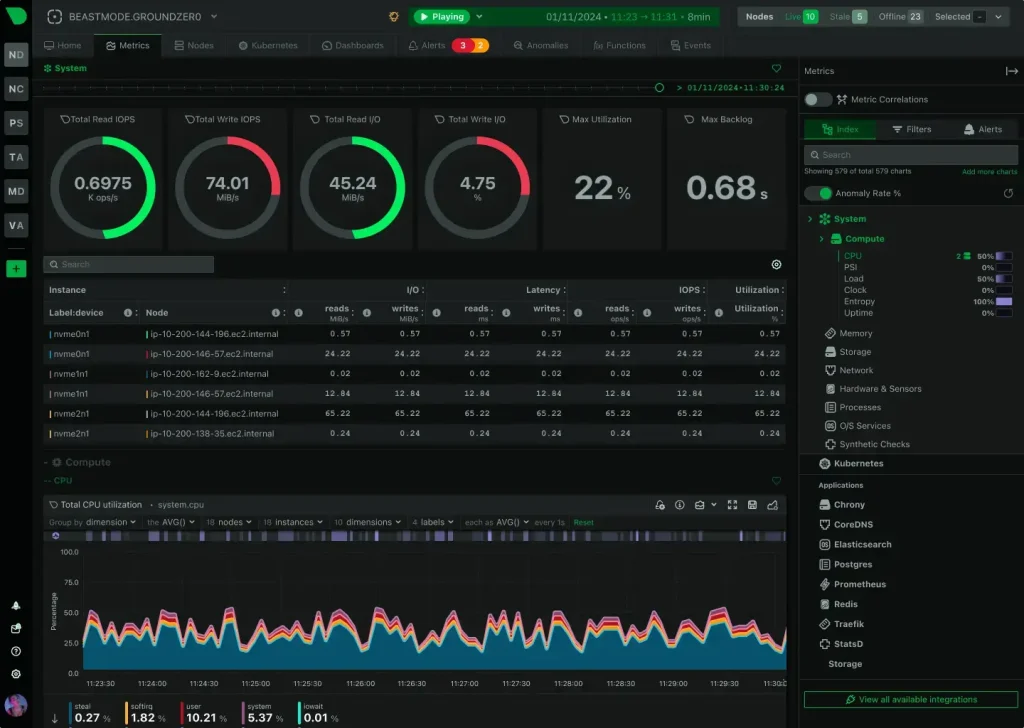
Why Choose It? Netdata gives second‑by‑second metrics in beautiful web dashboards with hundreds of charts. Great for desktops, servers, and homelabs.
- Auto‑detected metrics for system and apps
- Real‑time charts with minimal setup
- Health alarms and notifications
Quick Tip: 💡 Visit http://localhost:19999 after install to open the dashboard.
Support Links: Netdata Docs | Netdata Community
🌐 Download from the Official Website
3. Plasma System Monitor: Best for KDE Power Users
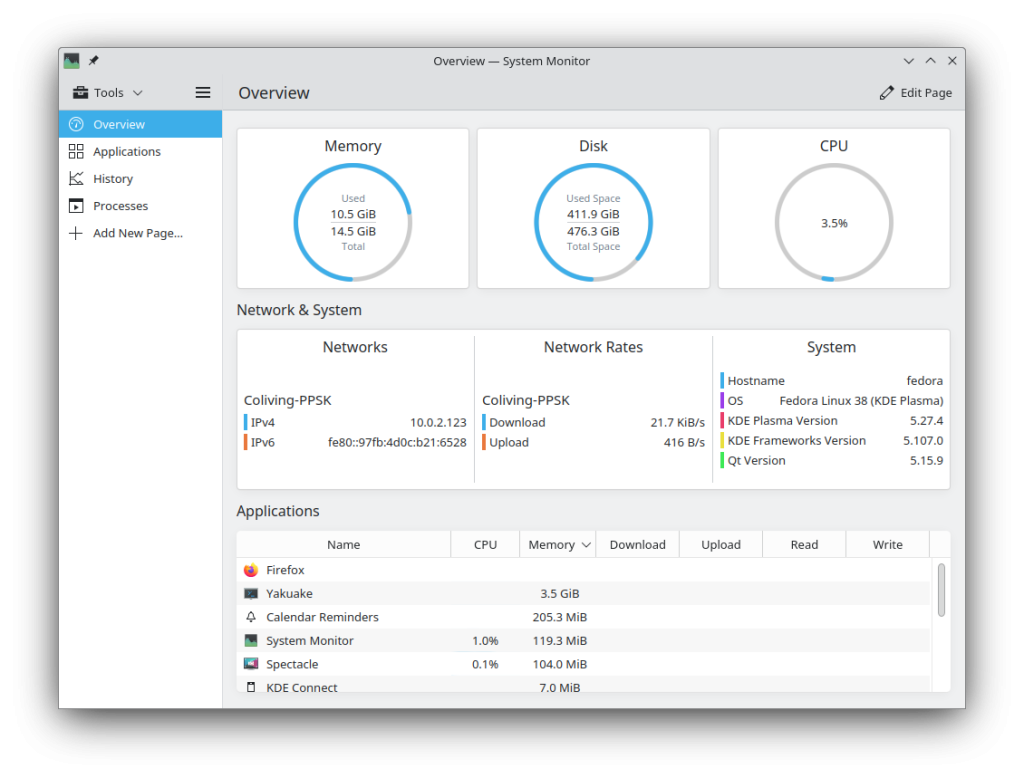
Why Choose It? Plasma System Monitor is a modern KDE app with customizable pages, deep sensor support, and gorgeous charts. It’s perfect if you live in the KDE ecosystem or love tailoring your dashboards.
- Customizable monitoring pages and widgets
- Detailed sensors, GPU, and disk I/O
- Fast, modern UI with KDE integration
Quick Tip: 💡 Add a custom page for servers or VMs to keep critical stats in view.
Support Links: KDE UserBase | KDE Reddit
🌐 Download from the Official Website
4. Mission Center: Best for Modern GTK Monitoring
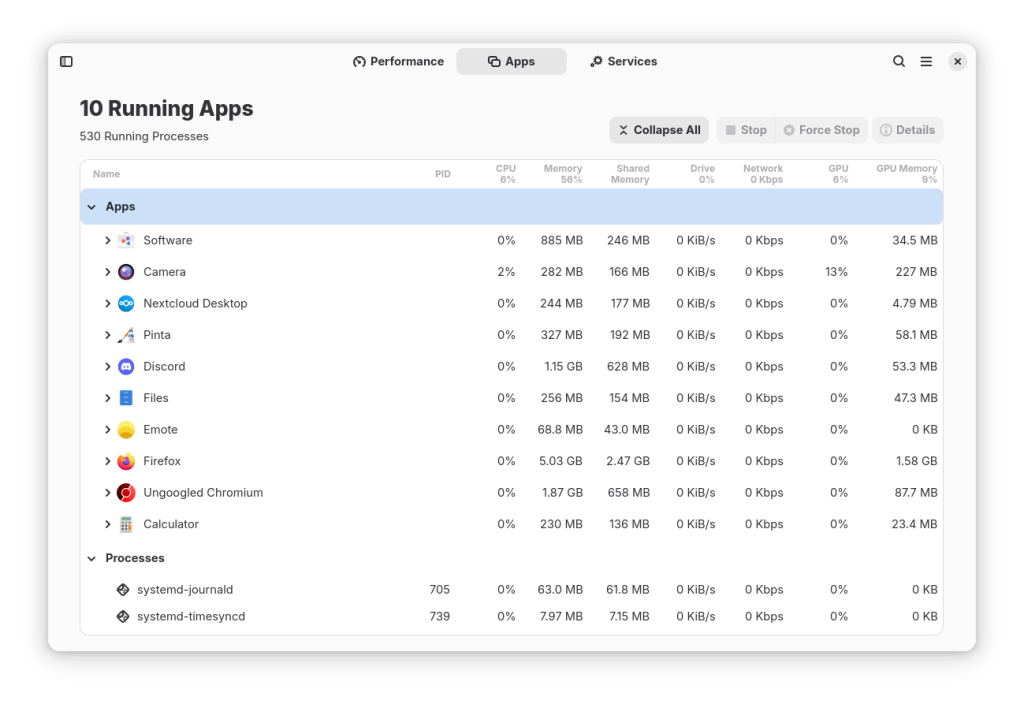
Why Choose It? Mission Center is a sleek, modern system monitor built with GTK and Rust, offering clear process views and responsive charts. It’s ideal if you want a fast, native-feeling GTK4 app with sensible defaults.
- Minimal, fast, and intuitive interface
- Per-process CPU, memory, and GPU stats
- Dark mode and Wayland-friendly
Quick Tip: 💡 Use the search bar to jump straight to heavy apps.
Support Links: Linux Reddit
🌐 Download from the Official Website
5. Resources: Best for Sleek Graphs & Process Control
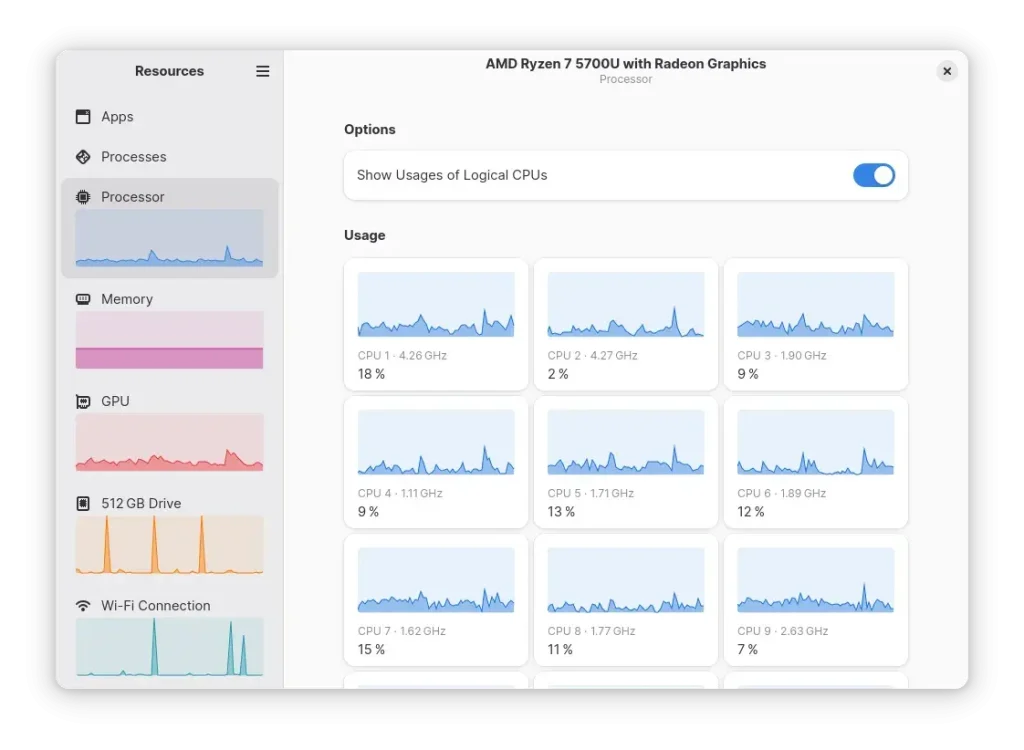
Why Choose It? Resources brings polished real-time graphs for CPU, GPU, RAM, disk, and network with a clean, modern UI. I like it when I want a visual, distraction-free way to monitor the system.
- Readable real-time charts for all core resources
- Searchable process list with details
- Flatpak for easy updates
Quick Tip: 💡 Pin it to your dock for one-click system health checks.
Support Links: GNOME Reddit
🌐 Download from the Official Website
6. GNOME Usage: Best for App‑Level Insights
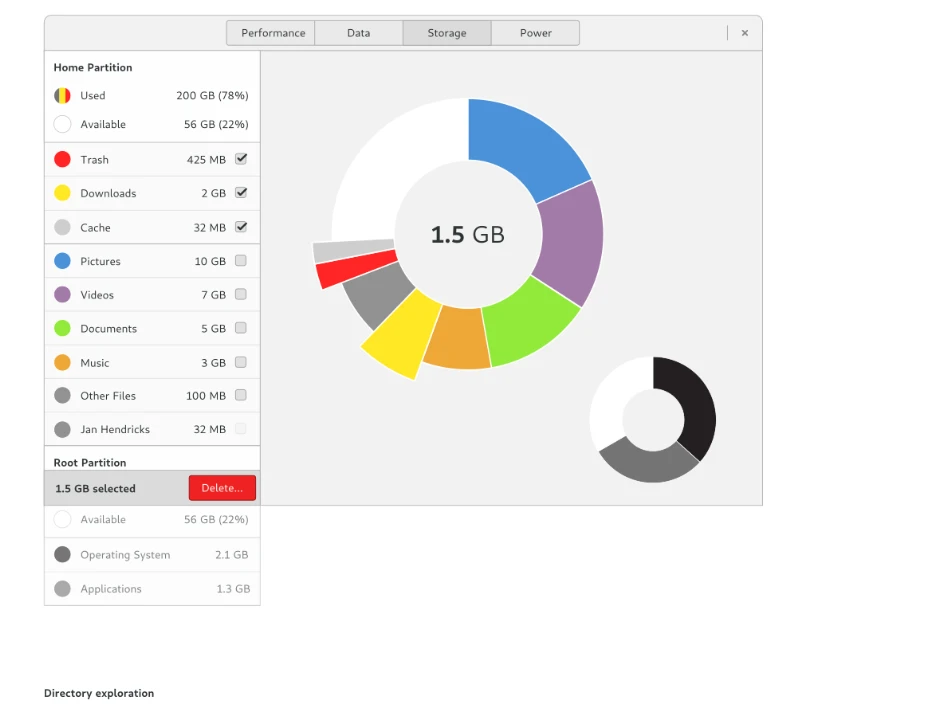
Why Choose It? GNOME Usage shows CPU, memory, and storage usage by app so you can quickly spot heavy processes. It pairs nicely with GNOME System Monitor for a full picture.
- Per-app CPU and memory breakdown
- Storage view with large file discovery
- Simple, beginner‑friendly interface
Quick Tip: 💡 Use the storage view to hunt down space‑hogging folders fast.
Support Links: Usage GitLab | GNOME Reddit
🌐 Download from the Official Website
7. CoolerControl: Best for Temperature & Fan Monitoring
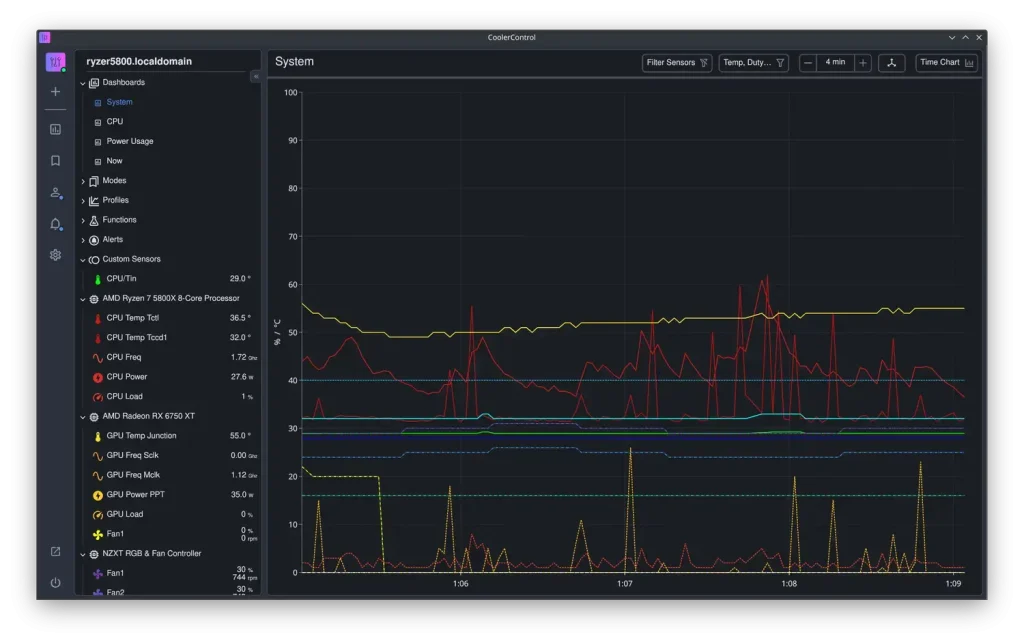
Why Choose It? CoolerControl is a feature‑rich Linux app for monitoring and controlling system cooling devices, including fans, pumps, and GPUs, with advanced profiles and alerts.
- Real‑time monitoring of temps, fans, and pumps
- Custom fan and pump profiles with automatic control
- Supports most NVIDIA/AMD GPUs and liquid coolers
Quick Tip: 💡 Run sudo sensors-detect to detect all sensors, and install liquidctl for enhanced AIO and USB fan hub support.
Support Links: CoolerControl Documentation | Linux Hardware Reddit
🌐 Download from CoolerControl GitLab
8. Hardinfo2: Best for Hardware Profiles & Benchmarks
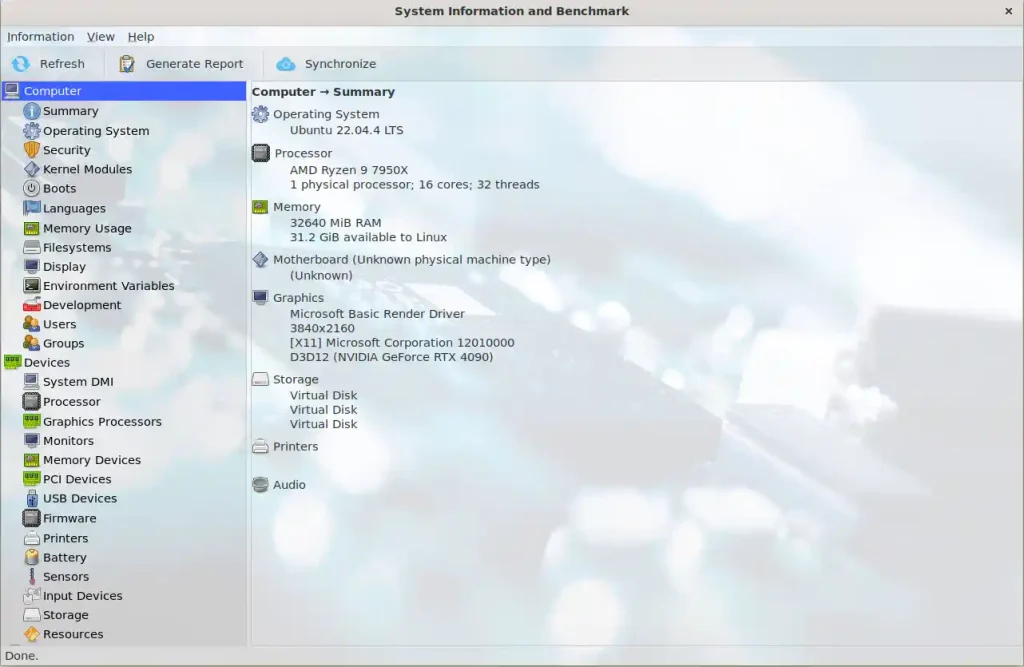
Why Choose It? Hardinfo2 gives you a deep system profile with hardware details, sensors, and simple benchmarks. It’s great for audits, troubleshooting, or sharing a full report.
- Comprehensive hardware and device information
- Built‑in benchmark suite
- Exportable reports for sharing
Quick Tip: 💡 Use the report feature to snapshot a system before and after upgrades.
Support Links: Hardinfo2 Issues | Linux Reddit
🌐 Download from the Official Website
9. Conky: Best for Desktop Widgets & Live Overlays
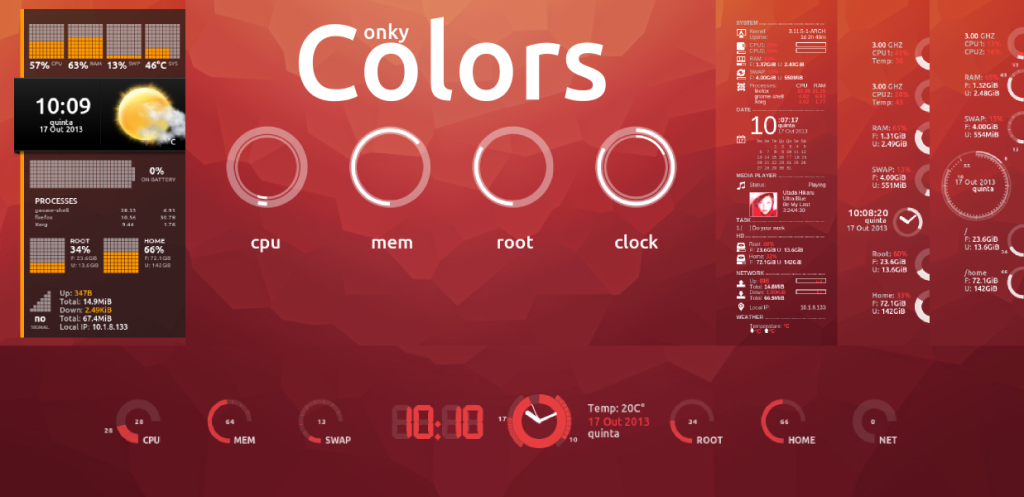
Why Choose It? Conky renders ultra‑customizable system widgets right on your desktop. From minimal stats to rich dashboards, it’s a visual treat for power users.
- Highly customizable themes and layouts
- Monitor CPU, RAM, disks, network, and more
- Very lightweight on resources
Quick Tip: 💡 Start with a premade theme, then tweak the config for your workflow.
Support Links: Conky Wiki | unixporn Reddit
🌐 Download from the Official Website
10. Cockpit: Best for Multi‑Server Monitoring
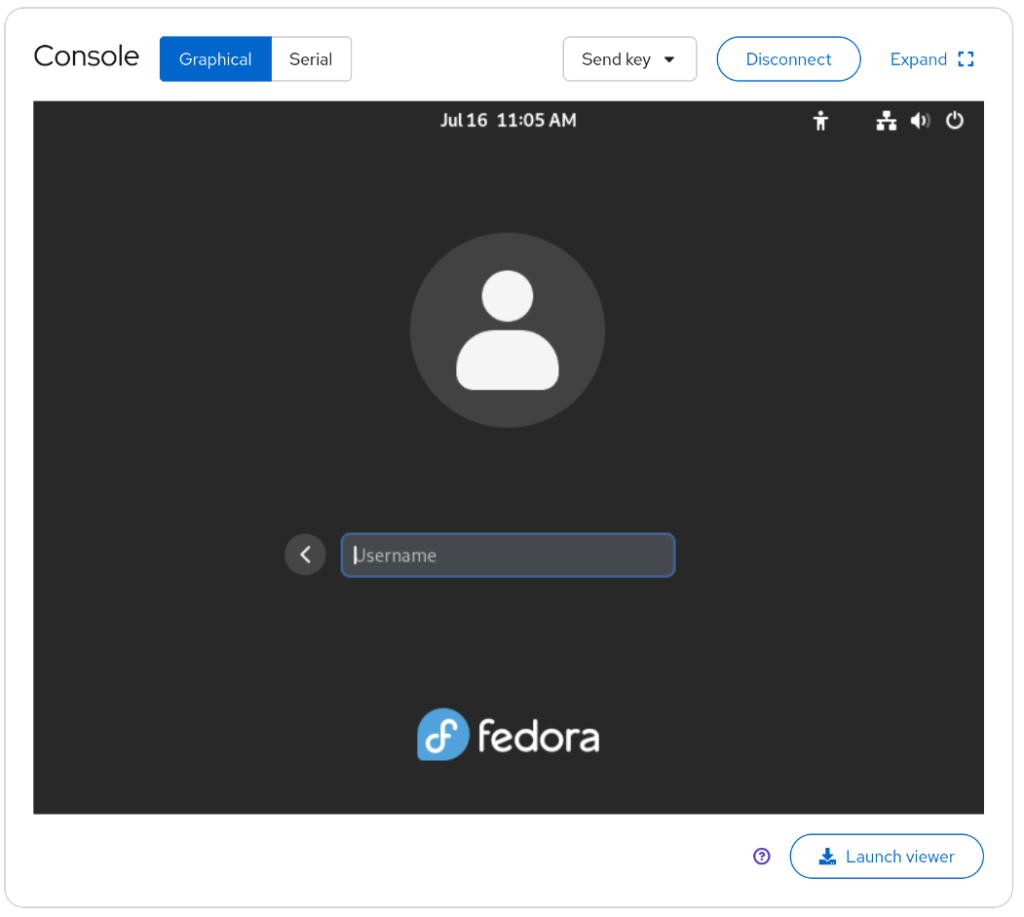
Why Choose It? Cockpit lets you monitor and manage services, logs, storage, and containers from your browser. It’s my pick when I want a web UI across multiple Linux machines.
- Live CPU, memory, disk, and network stats
- Multi‑server management
- Service, log, and update controls
Quick Tip: 💡 Add multiple hosts to get a single dashboard across your fleet.
Support Links: Cockpit Docs | Cockpit Blog
🌐 Download from the Official Website
11. MATE System Monitor: Best for Classic, No‑Nonsense Monitoring
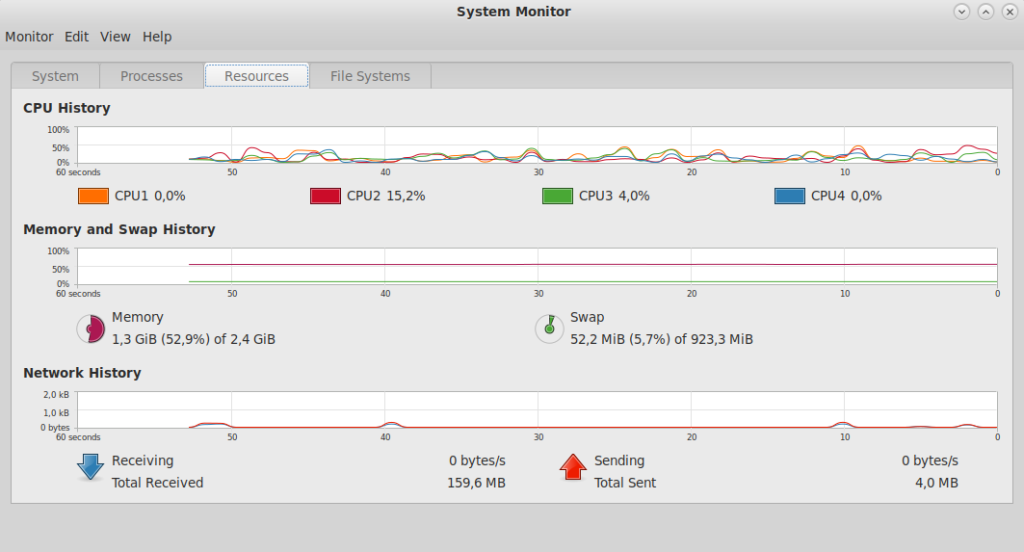
Why Choose It? MATE System Monitor keeps the classic GNOME 2 feel with clear process lists and resource tabs. It’s simple, stable, and familiar.
- Tabbed CPU, memory, and network views
- Process control with search and filters
- Lightweight on older hardware
Quick Tip: 💡 Switch to tree view to trace child processes easily.
Support Links: MATE Docs | MATE Reddit
🌐 Download from the Official Website
12. Qps: Best for Lightweight Process Management
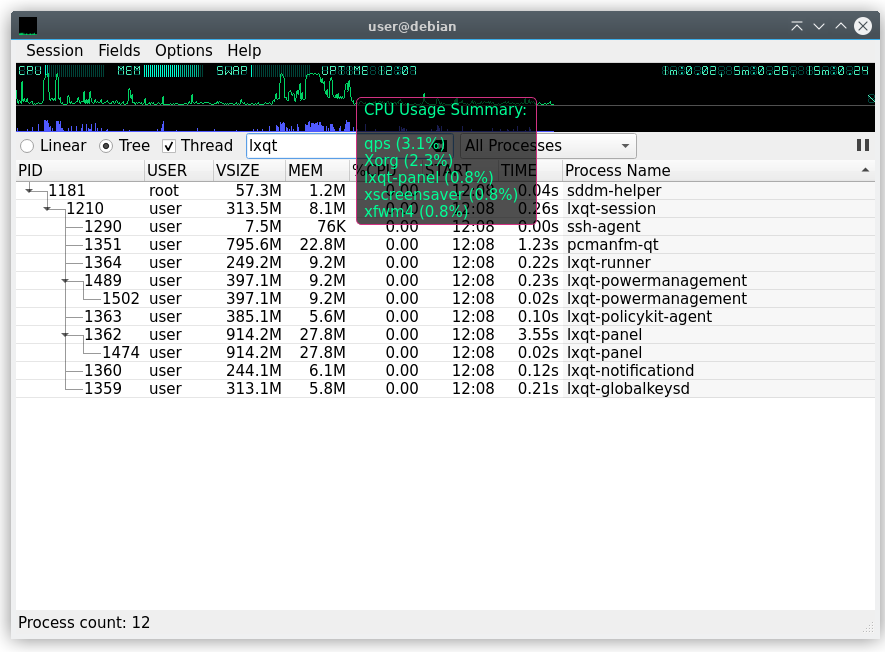
Why Choose It? Qps is a Qt‑based process manager with a compact design, perfect when you want a fast, focused view of what’s running. It’s a great fit on lightweight desktops.
- Tree and flat process views with filters
- Kill, renice, and monitor in real time
- Low resource usage and quick startup
Quick Tip: 💡 Toggle columns to surface I/O or memory fields you care about most.
Support Links: Qps GitHub | Linux Reddit
🌐 Download from the Official Website
Quick Links: Best Ai tools for Ubuntu, Best Code Editor for Ubuntu & Best Photo Editor for Ubuntu.


